
Reporting in FUTURA Smart
Overview
With the reporting functionality in FUTURA Smart, you can centrally analyze and flexibly evaluate event data. You can filter, structure, and display information from events such as RFQ, RFI, and RFP according to your needs. This gives you a clear overview of your procurement processes and enables you to make well-informed decisions based on up-to-date data.
You decide which data is displayed, how it is filtered, and how the results are structured. In addition, reports can be exported and further processed outside of FUTURA Smart.
Reporting combines flexible filters, configurable columns, meaningful KPIs, and export functions, allowing both quick overviews and detailed analyses.
Please note that access to reporting is currently restricted to administrators.
Accessing Reporting
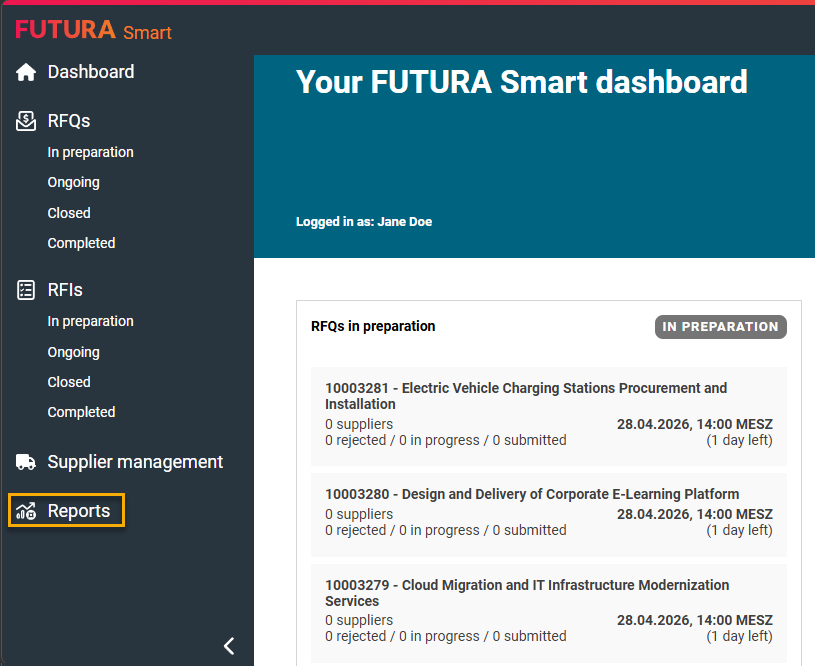
To open the reporting module, navigate to “Reports” in the left-hand menu. After clicking, you will be taken directly to the reporting view, where you can start analyzing your event data.
Structure of the Reporting Interface
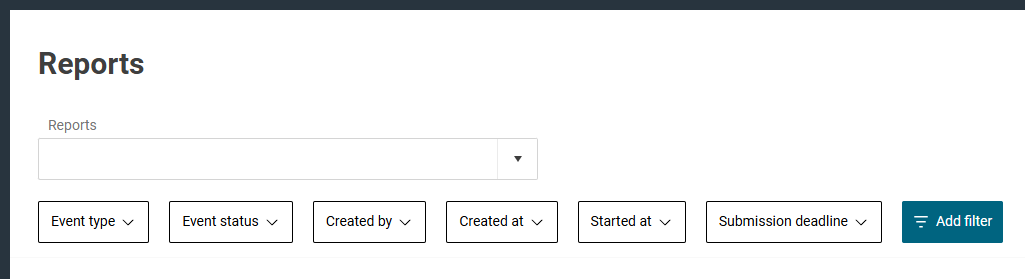
At the top of the page, you will find the filter options, which allow you to restrict the displayed data. Below that, the table view shows the results of your query. The interface also includes an action area where you can save or export reports.
The table view is the central element of reporting. All events are displayed according to your selected filters and column settings and can be analyzed directly.
Filter Functions
A key feature of reporting is the ability to filter data precisely. This allows you to reduce large datasets to only the information relevant to your analysis. Various filter conditions are available, such as equals, not equals, greater than, less than, between, and contains.
By default, several standard filters are available, including event type, event status, created by, and different date fields. These filters allow you, for example, to display only certain types of events, analyze a specific time period, or review the activities of individual users.
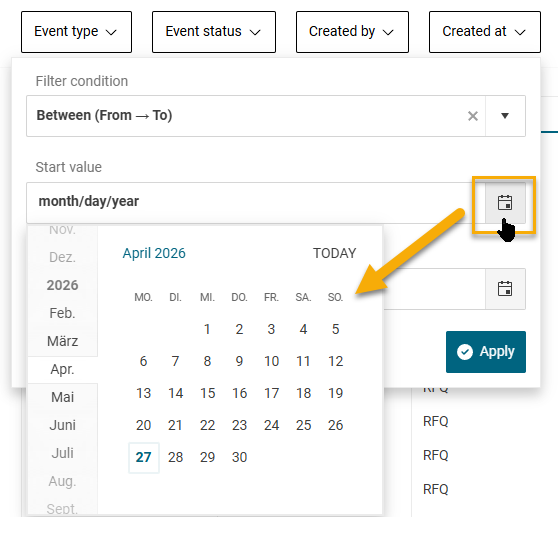
Here is an example with filter condition Created on and Between (from → to):
For more advanced analyses, you can add additional filters. Using the “Add filter” function, you have access to all available event properties. You can search for a specific property, select it, and define how it should be filtered.
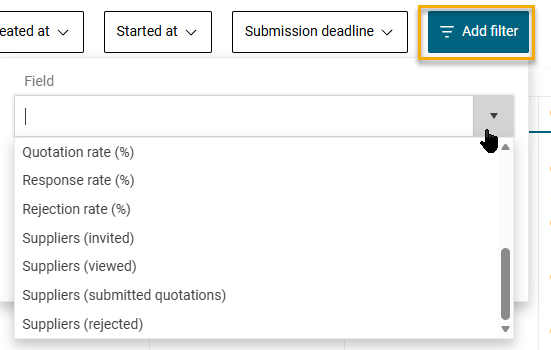
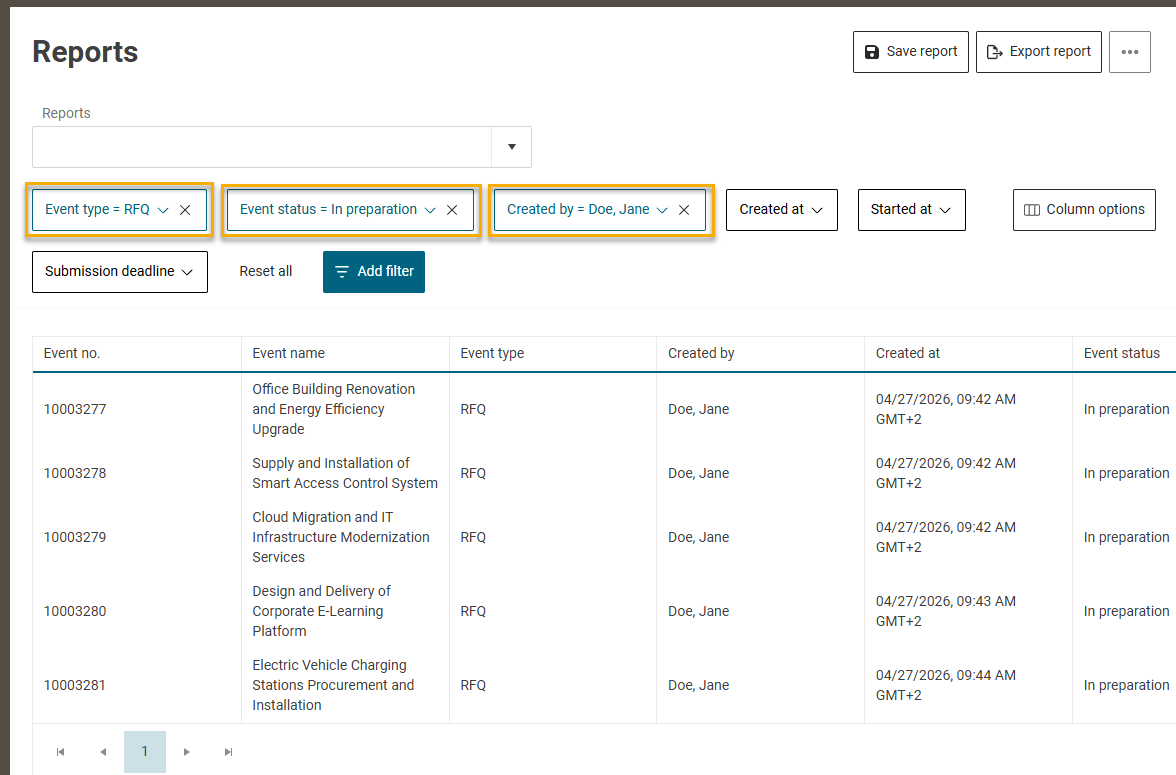
Multiple filters can be combined to create highly specific queries, such as displaying only events of a certain type, within a defined time range, and with a specific status.
Configuring Columns
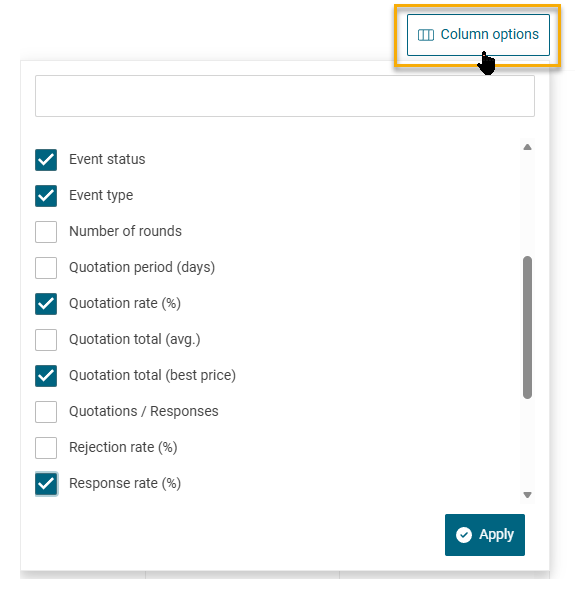
In addition to filtering, the way data is displayed plays a central role. In reporting, you can define which information is shown in the table.
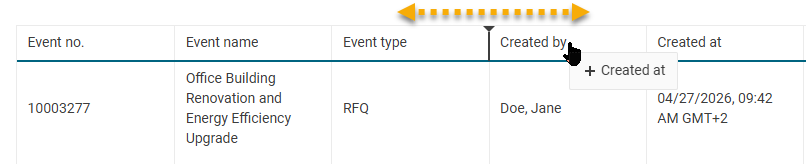
The report view supports configurable columns. You can select which event information should be visible, hide unnecessary columns, and add relevant ones. You can also reorder columns via drag and drop to tailor the view to your needs.
Available data includes, for example:
-
Event number and name
-
Event type and status
-
Created by and creation date
-
Start date and submission deadline
-
Technical and commercial contacts
-
Number of invited suppliers
-
Supplier status (e.g. participated, rejected)
You can also sort the table directly by clicking on a column header. This allows you to organize events, for example, by date, status, or quotation values.
Analyzing Data
Once filters are applied and columns are configured, the table updates automatically. You immediately see the results of your query and can begin your analysis.
The structured layout allows you to compare events, identify trends over time, and detect anomalies. By combining filters with flexible display options, you can analyze the data from exactly the perspective you need.
Working with KPIs
In addition to event data, reporting provides calculated key performance indicators (KPIs) that help you better understand the performance and efficiency of your events.
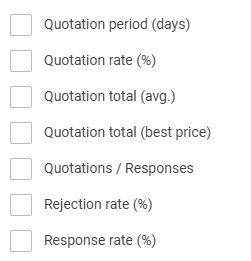
Available KPIs include, for example:
-
Best and average quotation values
-
Processing times and quotation periods
-
Event cycle times
-
Quotation, response, and rejection rates
These KPIs are based on underlying event, supplier, and quotation data and are automatically updated whenever you change filters or reload a report. This ensures that your analyses are always current and meaningful.
Saving and Reusing Reports
If you frequently use certain analyses, you can save them as reports. This allows you to reuse configurations without setting filters and columns again.
To save a report, click “Save report” in the top area, enter a name, and confirm. The system saves the full configuration, including selected filters, visible columns, column order, and sorting.
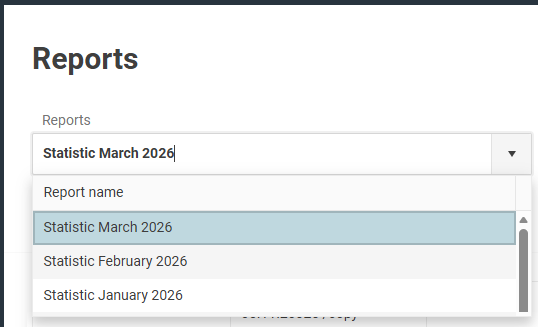
Saved reports can be loaded at any time via a dropdown menu. When a report is loaded, the configuration is applied and the data is recalculated automatically, ensuring you always work with up-to-date information.
You can modify existing reports at any time. Changes to column settings are applied automatically, while changes to filters must be saved manually. You can either overwrite an existing report or save it as a new version.
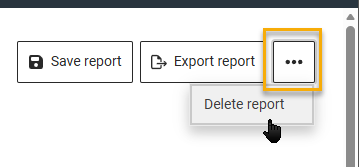
Reports that are no longer needed can be deleted using the delete function. After confirmation, the report is permanently removed.
Exporting Reports
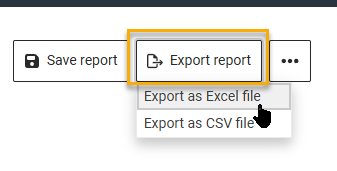
You can export your reports for further processing or documentation purposes. The export function is available in the top area.
After clicking “Export”, you can choose between XLSX and CSV formats.
The export always reflects your current view. This means that all applied filters, selected columns, column order, and sorting are included. You receive exactly the data displayed in the application.
Your language and formatting settings are also applied during export. Date and number formats match your individual configuration.
When exporting as CSV, values are provided without currency formatting. In XLSX format, currency and formatting are included.
The file name is generated automatically and contains the current date.